PowerPoint Presentation
Scene 1 (0s)
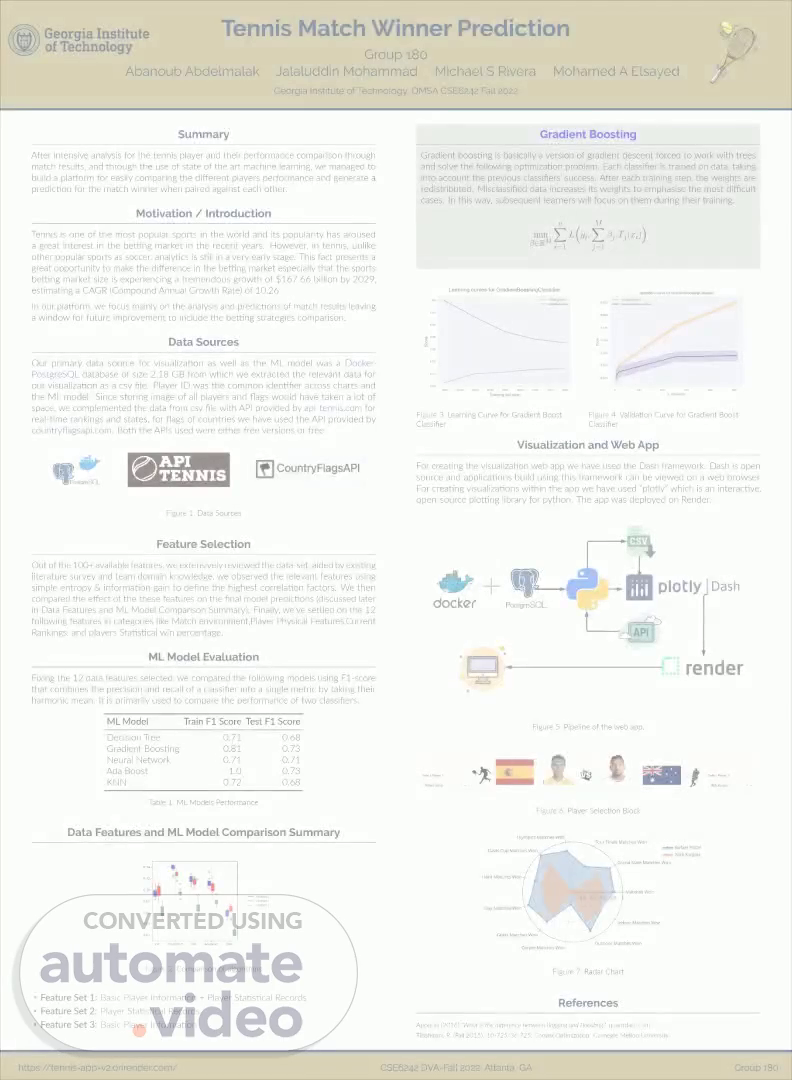
[Audio] Tennis is one of the most popular sports in the world and its popularity has aroused a great interest in the betting market in the recent years. However, in tennis, unlike other popular sports as soccer, analytics is still in a very early stage. This fact presents a great opportunity to make the difference in the betting market. After intensive analysis for the tennis player and their performance comparison through match results, we managed to build a platform for easily comparing the different players performance and generate a prediction for the match winner when paired against each other. Our primary data source for visualization as well as the ML model was a Docker image from a PostgreSQL database of 2.18 GB from which we extracted the relevant data for our visualization as a csv file. Player ID was the common identifier across charts and the ML model. Since storing image of all players and flags would have taken a lot of space, we complemented the data from csv file with API provided by api-tennis.com for real-time rankings and states, for flags of countries we have used the API provided by countryflagsapi.com. Both the APIs used were either free versions or free. We extensively reviewed the data-set, aided by existing literature survey and team's domain knowledge, we observed the relevant features using simple entropy & information gain to define the highest correlation factors. Out of the more of 100 available features, we settled on 12 high impact features as match court , height and weight, Current ATP Ranking, win percentage for each player. We used those features to train different machine learning models and compare its accuracy. Our best model, Gradient Boosting, performed 0.73 over 1 on the F1 score when tested in the test set. Our team developed a web application which can be used to compare tennis players and predict the winner among two players based on the results of our machine learning model. The web app involved several technologies and frameworks. In addition to the mentioned database stored as a docker image, we used python for feature engineering and model training. Dash, an open-source framework for data-based apps was used alongside Plotly to build a dashboard which was deployed to the internet Render. This project is the first step to build a full betting advisor app based on machine learning models..