PowerPoint Presentation
Scene 1 (0s)
[Audio] The data presented in this slide shows that mobility assets are not equally split among the seven offices and units, with RMFB13 having the smallest amount, 40% of the total, and SDNPPO having the most, 113% of the total. Despite having the highest percentage of mobility assets, SDNPPO lacks 14% of the total allocated assets. This inequality in mobility assets distribution across the offices and units is a cause of worry and highlights the necessity for equal sharing..
Scene 2 (36s)
[Audio] Data shows an unequal distribution of mobility assets. RMFB13 has the least, at 40%, while SDNPPO has the most, at 113%. Regarding serviceability, Patrol Cars have no available assets, while Buses have 100%. On the whole, mobility assets have an average serviceability of 87%..
Scene 3 (1m 5s)
[Audio] There is a clear discrepancy in the sharing of mobility assets between RHQ, BCPO, ADNPPO, ADSPPO, SDNPPO, SDSPPO, and DIPPO, shown by the figures on the table. RMFB13 possesses just 40% of the total assets, while SDNPPO has the most at 113%. This suggests that mobility assets are not being allocated fairly..
Scene 4 (1m 37s)
[Audio] Data on this slide shows a disparity in mobility asset distribution among RHQ, BCPO, ADNPPO, ADSPPO, SDNPPO, SDSPPO, and DIPPO. RMFB13 has the lowest amount of mobility assets, at 40% of the total assets, while SDNPPO has the highest, 113% of the total assets. This disproportionate division in mobility assets greatly hinders RMFB13's capability to effectively meet the needs of its customers..
Scene 5 (2m 17s)
[Audio] Seeing this data, it becomes clear that mobility assets are not equally distributed between units. Specifically, RMFB13 has the lowest number of assets, making up 40% of the total, while SDNPPO has the most, with 113%. This discrepancy is concerning and should warrant further investigation to look into ways to create an equitable distribution..
Scene 6 (2m 45s)
[Audio] The data in this table indicates an unequal distribution of mobility assets. RMFB13 has the lowest number of assets, with 40% of the total assets, whereas SDNPPO has the most with 113%. This must be taken into account when allocating resources among different divisions of the organization..
Scene 7 (3m 10s)
[Audio] Data indicates an inequitable distribution of mobility assets among RHQ, BCPO, ADNPPO, ADSPPO, SDNPPO, SDSPPO, and DIPPO. RMFB13 has the minimal number of mobility assets, making up 40% of the overall assets, while SDNPPO accounts for 113% of the total assets. In order to remedy this disparity and ensure that all offices are adequately equipped, we need to take this into consideration and take steps to close the gap..
Scene 8 (3m 49s)
[Audio] This slide demonstrates an unequal allocation of mobility assets, with RMFB13 having the lowest rate at 40% and SDNPPO having the highest rate at 113%. This discrepancy is highly concerning, and further research should be done to uncover the cause..
Scene 9 (4m 9s)
[Audio] Data in the table indicates an unequal distribution of mobility assets among the different offices and units. Regional Mobile Force Batallion 13 has the lowest share of assets, 40% of the total, while the Special District National Police Protection Office holds the highest proportion of assets, 113% of the total..
Scene 10 (4m 32s)
[Audio] From the table presented, it is evident that there is an imbalance in the distribution of mobility assets. RMFB13 has the lowest percentage with 40%, while SDNPPO has the highest with 113%. Additionally, none of the other offices and units have any assets. This establishes that there is substantial disparity between the offices and units in terms of mobility assets. To guarantee that all offices and units are provided with the appropriate amount of assets, the issue of asset distribution must be addressed..
Scene 11 (5m 12s)
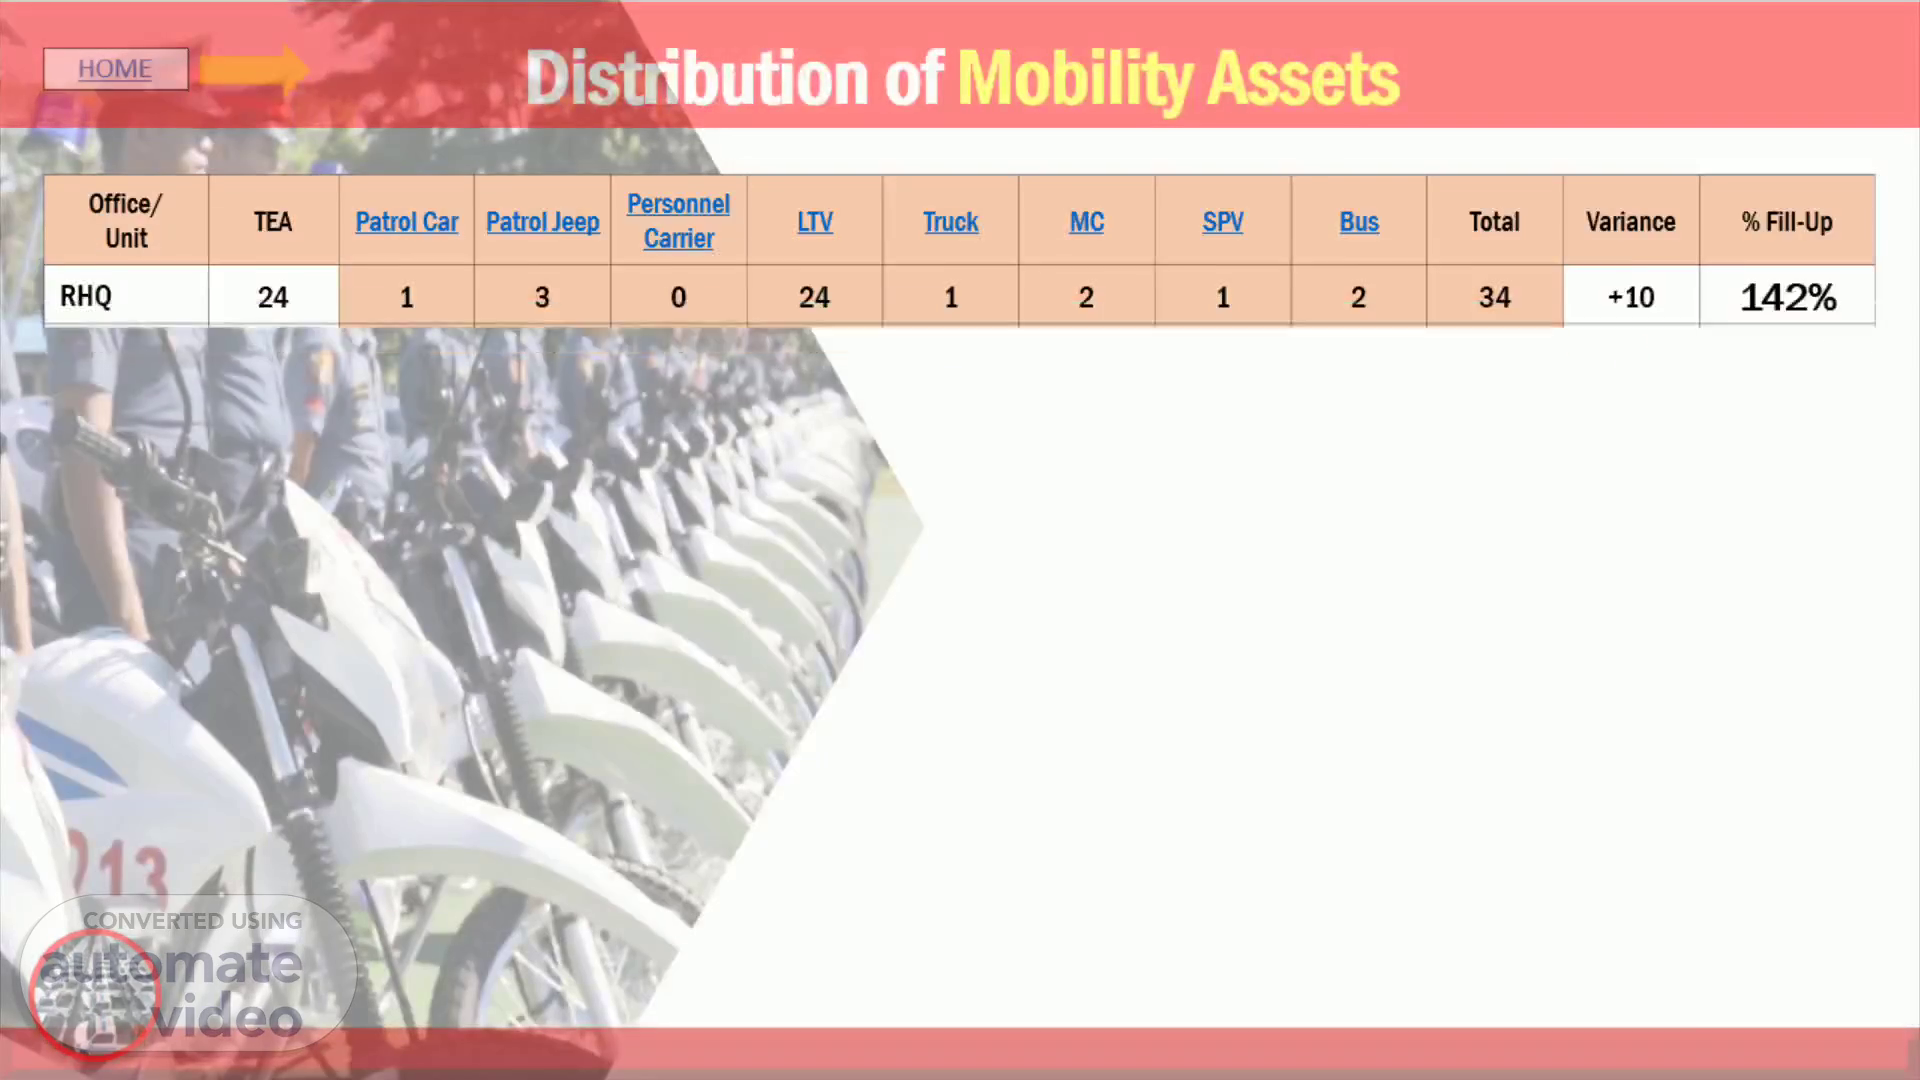
[Audio] This table displays the current situation of mobility assets across the Regional Headquarters, Border Control Police Office, Area Defense Northern Provincial Peace Office, Area Defense Southern Provincial Peace Office, Security Defense Northern Provincial Peace Office, Security Defense Southern Provincial Peace Office, and Defense Intelligence Provincial Peace Office. As you can see, the total number of mobility assets is 2. However, these assets are not equitably distributed, with RMFB13 having the least amount of mobility assets with 40% of the total, and SDNPPO having the highest amount, accounting for 113% of the total..
Scene 12 (5m 57s)
[Audio] The table presented shows a significant disparity in the distribution of mobility assets across RHQ, BCPO, ADNPPO, ADSPPO, SDNPPO, SDSPPO and DIPPO, with RMFB13 having the least number of mobility assets, 40% of the total assets, and SDNPPO having the highest number of assets, 113% of the total assets. This imbalance requires immediate attention in order to ensure the equitable distribution of mobility assets across all offices and units..