Project Quality, Communications, and Stakeholder Planning
Scene 1 (0s)
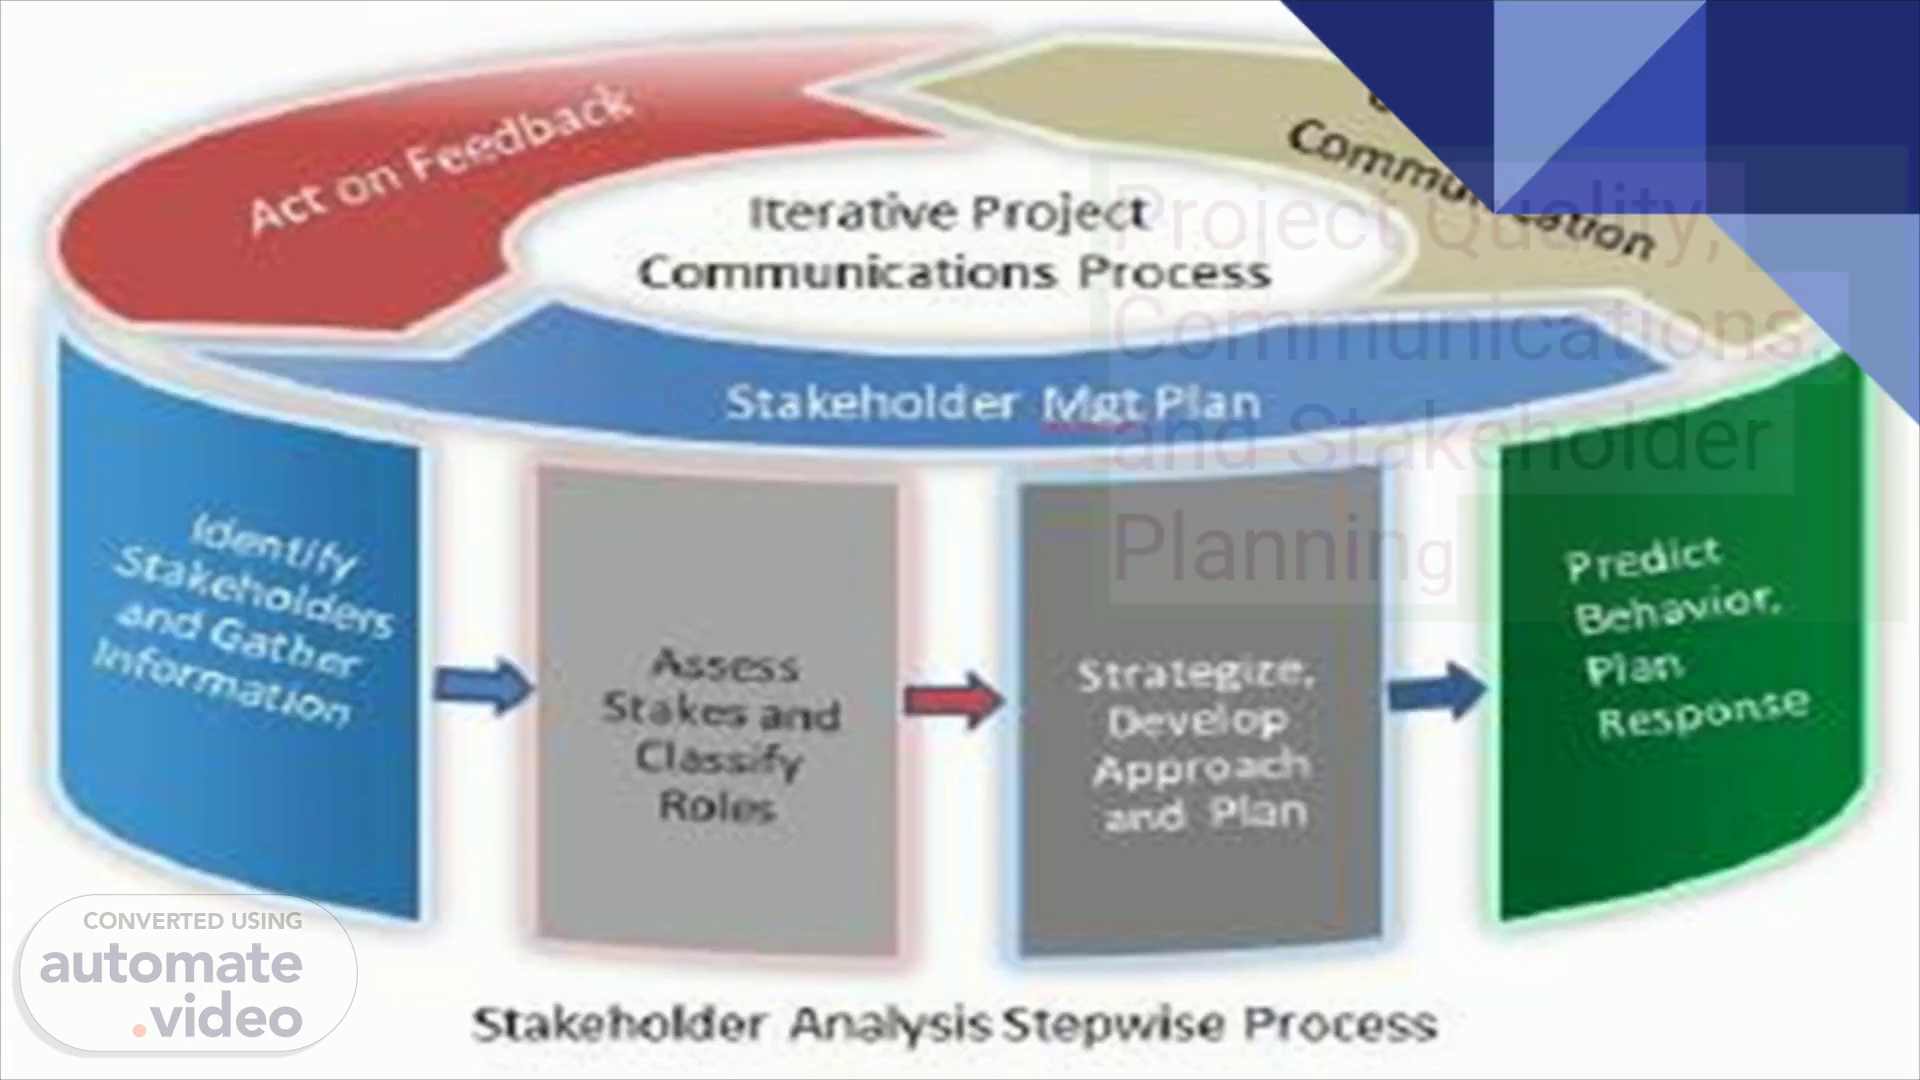
Project Quality, Communications, and Stakeholder Plannin g.
Scene 2 (8s)
Plan Quality Management. Plan Quality Management is the process of identifying quality requirements and/or standards for the project and its deliverables, and documenting how the project will demonstrate compliance with relevant quality requirements. The key benefit of this process is that it provides guidance and direction on how quality will be managed and validated throughout the project. The inputs, tools and techniques, and outputs of this process are depicted.
Scene 3 (1m 52s)
Inputs .1 Project management plan .2 Stakeholder register .3 Risk register .4 Requirements dounentation .5 Enterprise envirorvnental factors .6 Organizational process assets Tools & TEhniques .1 Cost-benefit analysis .2 Cost of quality .3 Seven basic quality tools .4 Benchmarking .5 Design of experiments .6 Statistical sampling .7 Additional quality planning tools .8 Meetings Outputs .1 Quality management plan .2 Process inprovement plan .3 Quality metrics .4 Quality checklists .5 Project documents updates Figure 8-3. Plan Quality Management Inputs, Tools & Techniques, and Outputs.
Scene 4 (3m 2s)
42 131 Collect 112 Project Quality 8.2 Perf«m Quality Assumce RAS.
Scene 5 (4m 4s)
The process of identifying quality requirements and/or standards for the project and its deliverables and documenting how the project will demonstrate compliance with quality requirements. • Includes the detailed definition and documentation of the quality assurance and quality control activities, processes and tools, as well as detailed quality requirements and quality standards. • The quality planning process (8.1) happens concurrently with the project management planning process (4.2) • Quality is often sacrificed when pressure is applied to reduce costs or timeframes • Occurs during Planning Monitor uti itiatio nnin Control.
Scene 6 (5m 5s)
Tools and techniques to Plan Quality Management Cost Benefit Analysis Cost of Quality enchmarkin Design of Experiments Meetings Statistical Sampling Additional Cause and ffect Diagra Flowcharts hecksheet Pareto Diagram Histogram Scatter Diagram Control Charts.
Scene 7 (5m 18s)
Quality Tools and Techniques. Cost of Quality - (Totals all costs incurred in quality assurance and quality control activities over the life of the project, product or deliverable. Includes cost of rework and defect rectification..
Scene 8 (8m 0s)
Benchmarking — Vgenerates ideas for quality improvements by comparing specific project practices or product characteristics to those of other projects or products within or outside the performing organisation, relates to lesson learnt Cost Benefit Analysis — Primary benefits of meeting quality requirements are less rework, higher productivity, lower costs and increased stakeholder satisfaction. Compares the cost of the quality activity with the benefits. Flowcharting and Process Analysis— V Graphical representation of a process that helps to identify potential quality problems. Examination of process efficiency and failures Step Step Step.
Scene 9 (12m 53s)
Inspection — Examination of a deliverable or product to determine if it meets the documented quality standards and requirements Cause and Effect Diagrams — Ishikawa or fishbone diagrams. Illustrate the linkages between quality problems and their potential causes Failure Mode Effects Analysis — V More comprehensive that Cause and Effect Diagrams, involves determining ALL potential failures, the impacts of the failures and actions to both manage and prevent failures.
Scene 10 (15m 41s)
Checksheets — Used to organise facts to aid collection of data Name of Data Data Conection Dates: Detect Tym Suppued rusted Misaugned weld test procedure Wrong part issued on parts VOÉIS in casting Incorrect dimensions Adhesive failure Masking insufficient Spray failure TOTAL Lester B. Raoo Rochester New York 1/17 - 1/23 Monda 10 Tues 13 Dates Wednes 10 Thursd 5 Frid 4 TOTAL 2 Example from: http://upload.wikimedia.org/wikipedia/commons/3/3a/Check_sheet_for_motor_assembly.svg.
Scene 11 (15m 58s)
Histograms — Bar chart used to document the frequency with which certain events (defects or failures) occur Pareto Charts or Pareto Diagrams — V Type of histogram that is ordered by frequency of occurrence. It shows the defects generated by the categories of the identified causes Run Chart - Similar to a control chart but doesn't display the upper and lower performance limits, shows total variation in a process over time to enable trend analysis.
Scene 12 (17m 49s)
Scatter Diagrams — Correlation charts Plots a change in relationship between two variables 100 74 14 16 18 22 24 26 28 30 Temperature (Oc) Example from: http://www.bbc.co.uk/schools/gcsebitesize/maths/statistics/scatterdiagramsrev2.shtml.
Scene 13 (18m 10s)
Control Charts — V Statistical method used to determine if a project or production process is stable and has predictable performance. The upper and lower limits relate to the requirements. Statistical Sampling — Examines a selection or sample group of outputs, products or deliverables for conformity to the requirements and quality standards Design of Experiment - Statistical method for identifying the factors that have the most influence over the quality of the end product, determines the accuracy of testing activities.
Scene 14 (20m 4s)
Outputs of this process include — v Quality Management Plan — Detailed in the next slide Quality Metrics — Part of detailed quality requirements V Quality Checklists — Part of Quality Control and sign off processes Process Improvement Plan - advanced technique — Most relevant to projects with specific process improvement outcomes, e.g. those using Six Sigma's project methodology Project Document Updates itiati — Stakeholder Register and Responsibility Assignment Matrices (part of Project Human Resources) Monitor lannin ecutio Control Close.
Scene 15 (20m 20s)
Plan Communications Management. The process of developing an appropriate approach and plan for project communications based on the stakeholders information needs and requirements, and available organisational assets..
Scene 16 (21m 24s)
Inputs into Plan Communications — Project Management Plan Stakeholder register Enterprise environmental factors — Organisation structure — Project Management maturity helps to determine the type and frequency of communication V Organisational process assets — Relevant policies and procedures — Lessons learned from past projects.
Scene 17 (21m 51s)
Tools and techniques to Plan Communications Management — ommunicatio Models ommunicatio Technology ommunicatio Media ommunicati Requirements Analysis ommunicatio Methods Meetings.
Scene 18 (22m 0s)
Communication Requirements Analysis. Information used to determine specific project communication requirements includes — — Organisation charts — Project Organisation and Governance Charts — Stakeholder responsibilities — Disciplines, departments and specialisations involved in the projects eg. Finance, legal, risk — Logistics of communication — how many people, location — Internal information needs — across organisation — External information needs — media, contractors, public — Stakeholder register and stakeholder management strategies.
Scene 19 (23m 1s)
Encode Sender Decode Noise Transnit Messae Messaæ Medium Fædback Messag Decode Receiver Encode.
Scene 20 (23m 37s)
Communications technology factors that can affect the project include — — The urgency of the need for communication — The availability of technology — Ease of use — The project environment — Sensitivity and confidentiality of information.
Scene 21 (24m 30s)
Communication Media and Channels Informal vs Formal Group briefings Traditional vs Electronic Presentations One on One Meetings Collaboration Sites Steering Committee Presentations Stakeholder Meetings Team Meetings Push vs pull Email Status Reports Newsletters.
Scene 22 (27m 5s)
Interactive Two or more parties Multi directional exchange of information Efficient way to ensure common understanding Meetings Phone calls and teleconferences Video conferences push Sent to specific recipients Need to know basis Dæsn't check understanding Letters, memos. Reports Emails, faxes Voice mail Press releases pull Used for large volumes of information Large audiences can self serve Can't determine understanding Access at own discretion Intranet sites E-learning Knowledge repositories Collaboration sites.
Scene 23 (28m 5s)
Outputs of this process include — V Communications Management Plan — Stakeholder Communication requirements — Resources allocated to communication activities — including time and cost — Escalation, approval information flow processes — Glossary of terms Project Document Updates — Project schedule — Stakeholder register — Stakeholder management strategy — Project risk register — Risk Management Plan.
Scene 24 (28m 36s)
Target Audience Who to Project Sponsor Project Manager Local Council Neighbors Fitter Communication Needs What Progress and performance with regards to schedule & bud et• The requirements for the project, budget maximum. Champion the project with other stakeholders. Assurance of adherence to council rules When does the project start and finish; how will it affect them needs to know when he should start work and what the PMs expectations are Messenger Who from Project Sponsor Vehicle (How?) How Status Report Face to face meetin Project Charter Monthly meetings with Stakeholders Written development a lication Leaflet Email prior to start of his tasks face to face verbal once he starts his tasks Frequency When Weekly Weekly At the start of the project. During the execution phase. one off twice - beginning and end of ro•ect daily.
Scene 25 (29m 36s)
Stakeholder Relationship management. Stakeholder Mapping Continuous Improvement Stakeholder Relationship Management Continuous Improvement Presentation ocus Stakeholder Engagement.
Scene 26 (29m 58s)
SRM - Framework. Stakeholder Analysis and Mapping Identify key stakeholders Define stakeholders concerns & issues Assess their level of commitment and resistance Communication Strategy and Planning Review methods to inform different groups including timing / frequency Use the communication plan and create continuous dialog with all stakeholders Obtain feedback and involvement Engagement Strategies and Techniques Techniques to involve the stakeholders in the design and implementation Continuous Assessment and Follow through Clarification of roles and responsibilities for SRM Validate & evaluate communication processes.
Scene 27 (30m 50s)
Stakeholder Engagement. Influence Ability to have input Marginalised groups Empowerment Type Beneficiary Provider • Policy maker Stage • Early development stage • Implernentation stage Assess outcorne • Combination Communication • Electronic (email. web) • Face-to-face • Audio (radio) • Visual (video. television. play) • Written (poster. reports, fact stun'ts) • Language Importance • tor action • Permissions • Key activities/participation Project Stages & Engagement level • HIGH: decision making • MEDIUM: options noted • LOW: information only Areas Networks • Government • Community • Industry Strengths • Skills & technical knowledge Exm*rience • Culture and custom • Availability Special considerations • Marginalized groups • Barriers to engagement • individual circumstances Resources • To implement action To mobilise • Infrastructure • Transport • Manpower • • Physical • POIjuca1.
Scene 28 (32m 31s)
Steps in Engaging Stakeholder. Identify important stakeholders and their interests Assess the power and influence of stakeholders in relation to the project Determine appropriate project response to each stakeholder / group Plan which stakeholders will participate in the project cycle, when and how Identify stakeholder risks Develop strategy for building participation and stakeholder commitment..
Scene 29 (33m 52s)
Why Engage. Transparency Better targeting Better information Improves risk management Increases efficiencies and accountabilities.
Scene 30 (33m 57s)
Stakeholder Engagement - Process. Measure and report progress Respond to engagement results Assess the engagement process Set engagement objectives Repeat process Identify and assess stakeholders Develop engagement plan & techniques Implement engagement plan.
Scene 31 (34m 30s)
Engagement - Principle / Objectives. • Timely • Feedback • Resourcing • Independence • Clear objectives • Capacity to influence.
Scene 32 (34m 42s)
Stakeholder Engagement — Identify / Assess. Resources Collabo- rative Rules Credibility Cost Effectivenes s ee Oe Identificatio n/ Assessment Competenc Y Secure Expectation.
Scene 33 (35m 7s)
• Identify the purpose Ensure organisational buy-in Resourcing — money and staff Communication strategy Check leading practice principles Plan implement feedback Understand the capacity of stakeholders to influence outcomes Develop engagement strategies.
Scene 34 (35m 30s)
• Artifacts collected • Minutes from stakeholder agreement meetings • Review comments and approvals • Formal / informal review • Presentations / minutes / attendees • Training presentations / attendees • Monitoring artifacts (attendance notes, emails to key stakeholders who missed meetings, etc.) • Status reports where critical issues exist.
Scene 35 (35m 59s)
Cost effectiveness Level of participation Commitment to process Efficiency of delivery of plan Usefulness of the information Changes in stakeholders' views / perceptions Extent to which they are being heard being and influence.
Scene 36 (36m 23s)
Stakeholder Roles Degree of Involveme nt Outcomes Stakeholder Engagement Process Engagemen Evaluation Organi- sation Overall Satisfaction Goals Realised Design.
Scene 37 (36m 39s)
Project Risk Management Planning.
Scene 38 (36m 49s)
Risk Management planning. the systematic process of identifying, analyzing, and responding to project risk.” An organization identifies, in its risk management plan, the approach, plan, and who will execute the risk management activities. The risk management plan is created early in the planning phase of the project and updated throughout the life of the project.
Scene 39 (37m 17s)
Identifying Risks. Risk identification is not a one-time process done only at the beginning of a project but should be a continuous process of team members and stakeholders—not just the project manager—looking for new issues that may affect the success of the project..
Scene 41 (40m 52s)
The risk register is the main deliverable from the risk identification and analysis process The risk register is a dynamic document that must be continually updated as a project progresses.
Scene 42 (41m 46s)
Responsible This is the name of the person (preferred) or group/department responsible for monitoring the risk and executing mitigation activities. Using the previous example, a software development project leader may be assigned responsibility for tracking a vendor’s progress Consequence This is an explanation of the impact to the project if the risk occurs. Using the previous example, if a vendor is late with its part of a system, the entire project schedule will be delayed, also raising the project budget. Probability This is an estimation of the likelihood that the risk will materialize and affect the project. The probability is often a qualitative rating (low, medium, high) or could be a more quantitative number Mitigation This is an explanation of the strategy being used to reduce the chances that the risk will occur. Using the previous example, say that the team decided to set up multiple two-week milestones for the vendor to keep an eye on the vendor’s progress and make sure it doesn’t start slipping..
Scene 43 (42m 43s)
Perform Qualitative Risk Analysis. The process of prioritising risks by assessing and combining their probability of occurrence and the consequences of their impacts.
Scene 44 (43m 10s)
Perform Qualitative Risk Analysis. Inputs to Qualitative Risk Analysis Draft Risk Register Risk Management Plan Project Scope Statement Enterprise Environmental Factors: Industry studies of similar projects Risk ID MKOOI Risk Category Marketing — Risk databases from industry or proprietary sources V Organisational Process Assets - — Risk management standards — Risk management policies and procedures — Risk categories and definitions — Standard templates itiati — Lessons learned from previous projects — Risk databases and checklists Risk Description Marketing may not be able to the required advertising with the Fairfax group due to conflict of interest Monitor lannin ecutio Control Risk Owner Brian Green Close.
Scene 45 (43m 24s)
Tools and techniques for qualitative risk analysis include - Risk Probability & mpact Assessmen Expert Judgement Probability & Impact Matrix Risk Urgency Assessment isk Data Qualit Assessment Risk ategorisation.
Scene 46 (43m 37s)
Risk Data Qua ity Assessment - Assess the degree to which the data about risks is useful for risk management Factors: - Degree to which the risk is understood - Accuracy, quality, reliability and integrity of the data about the risk.
Scene 47 (44m 21s)
Performing Quantitative Risk Analysis. The key difference between the two analysis methods is that quantitative analysis is based on mathematical or statistical techniques to model the behavior of a particular risk. The decision about whether to use quantitative or qualitative analysis techniques is made on a project-by-project basis and even within a single project can be made on a risk-by-risk basis.
Scene 48 (44m 49s)
DECISION TREE ANALYSIS WITH EMV. Decision tree analysis is generally used along with a graphical representation that describes a set of options under consideration along with estimated implications of each option. The analysis consists of costs, revenues (or benefits), and probabilities for each option path.
Scene 49 (45m 13s)
Initial Question Options In-house development Key piece of software Outsource Outcome Probabilities .2 .1 .6 .4 Outcome +1— -90,000 50,000 100,000 90,000 -1 oo,ooo Expected Value -63,000 = 10,000 = 10,000 Total = -43,000 = 54,000 = -40,000.
Scene 50 (45m 18s)
MONTE CARLO SIMULATION. It can also be used during quantitative risk analysis to simulate the impact a risk may have on project goals.