Page 1 (0s)
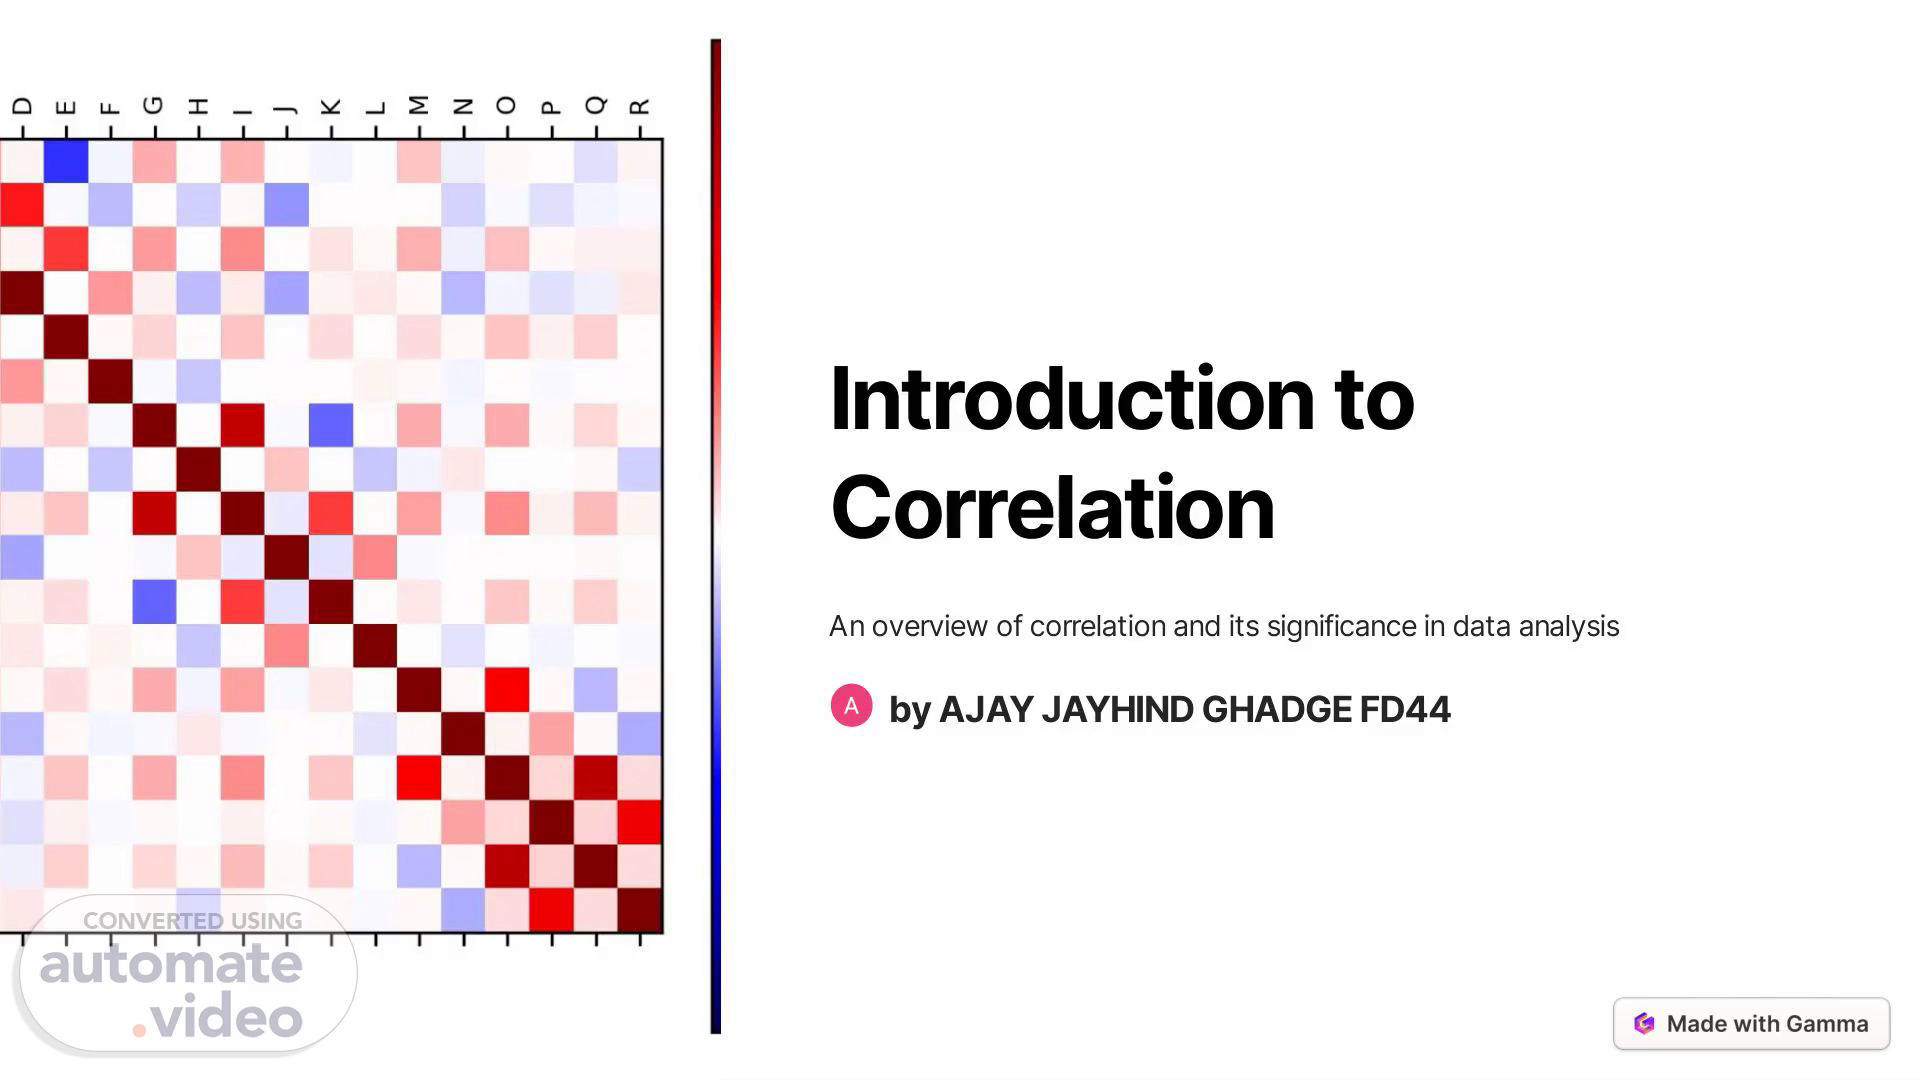
[Audio] Introduction to Correlation An overview of correlation and its significance in data analysis by AJAY JAYHIND GHADGE FD44.
Page 2 (12s)
[Audio] Definition of Bivariate Data Two Variables Data involving two variables or attributes Scatter Plot Visual representation of bivariate data Real-world Example Application of bivariate data in a practical scenario.
Page 3 (26s)
[Audio] Explanation of Scatter Diagram Visual Representation Graphical illustration of data points on a coordinate system Relationship Clarity Clear depiction of the relationship between two variables Pattern Identification Identification of patterns and trends within the data.
Page 4 (42s)
[Audio] Positive Correlation and Its Representation 1 Direct Relationship Both variables increase or decrease together 2 Upward Trend Graph displays an upward trend from left to right 3 Strength Variation Variation in the strength of positive correlation.
Page 5 (1m 3s)
[Audio] Negative Correlation and Its Representation 1 Inverse Relationship Variables move in opposite directions 2 Downward Trend Graph demonstrates a downward trend from left to right 3 Strong vs. Weak Comparison between strong and weak negative correlation.
Page 6 (1m 24s)
[Audio] No Correlation and Its Representation Random Scatter Data points scattered randomly on the graph Null Association No clear association between the variables Irrelevant Trend Lack of any discernible trend or pattern.
Page 7 (1m 38s)
[Audio] Strength of Correlation and Its Representation 1 Weak Correlation Scattered and loosely clustered data points 2 Moderate Correlation Reasonably structured relationship between variables 3 Strong Correlation Tightly clustered and closely related data points.
Page 8 (1m 59s)
[Audio] Conclusion and Summary of Types of Correlation Positive Both variables move in the same direction Negative Variables move in opposite directions No Correlation No clear relationship between variables.