Financial Services Provider
Scene 1 (0s)
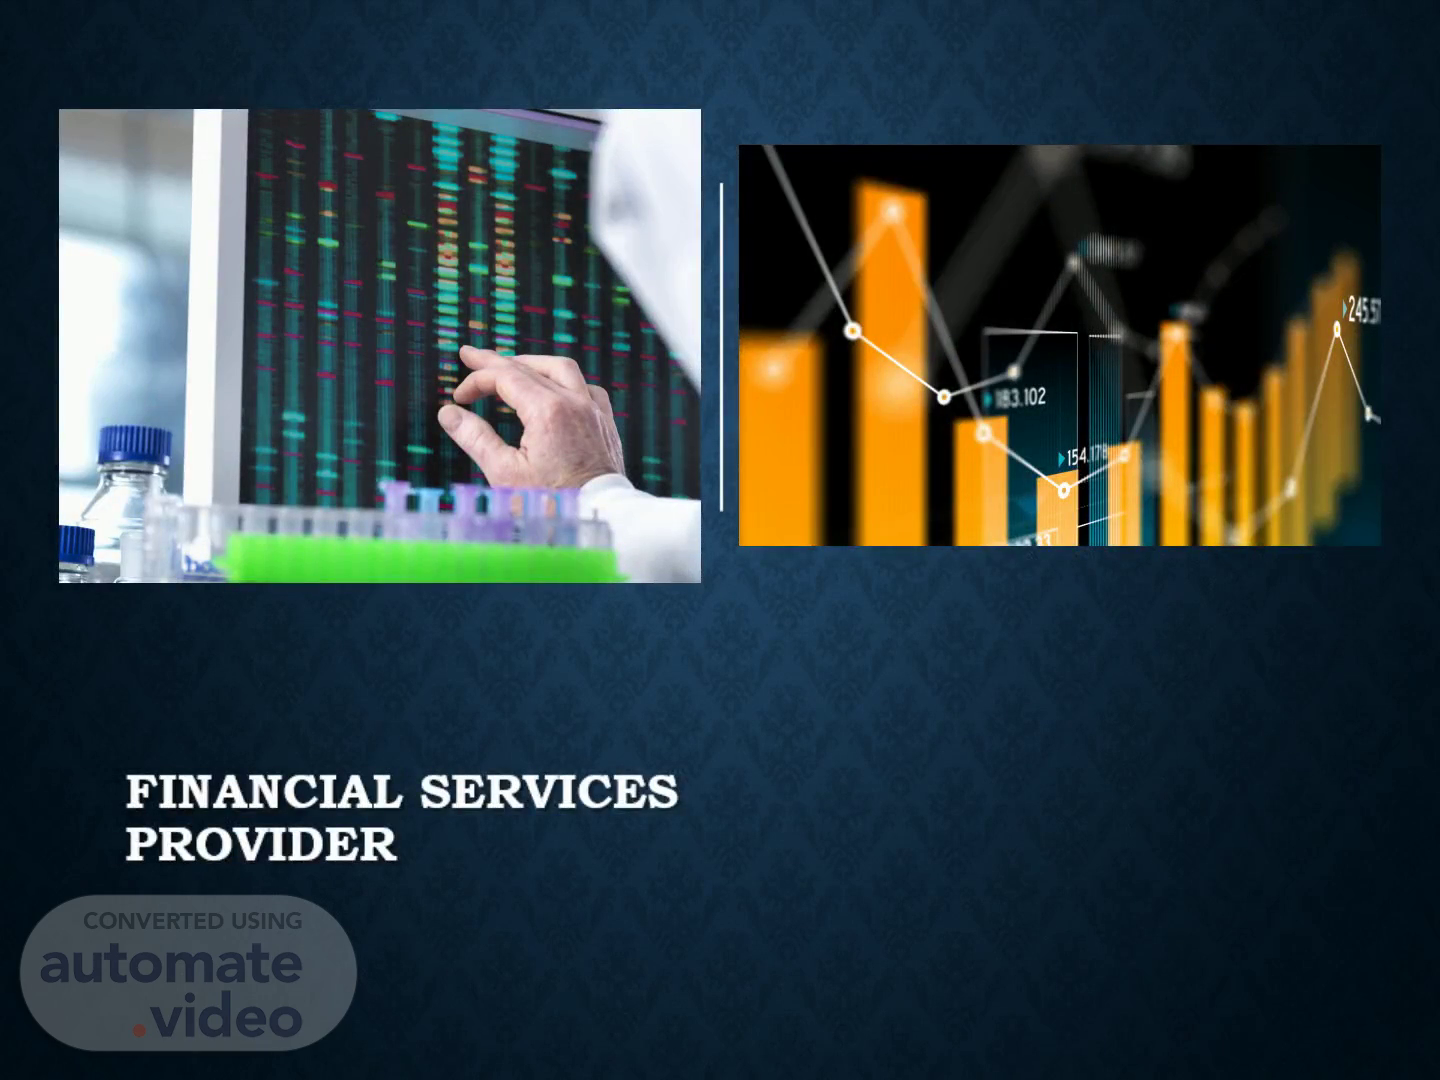
Financial Services Provider. Scientist viewing DNA test results on a computer screen in the laboratory.
Scene 2 (9s)
Digital numbers and graphs. Cash and Marketable securities Management..
Scene 3 (17s)
Articles writing Blog Writing. Pencil with solid fill.
Scene 4 (26s)
Ratio Analysis. Ratios 2019 2020 2021 2022 Current Ratio 2:1 2:2 2:4 4:3 ROA 30% 45.65% 29.3% 35% AAR 4.5 times 3 time 2.9 times 3 times APR 3 times 4.2 times 6 times 2.1 times.
Scene 5 (42s)
Calculator, pen, compass, money and a paper with graphs printed on it.
Scene 6 (54s)
Measuring Portfolio Risk, (CAPM, Arbitrage Pricing Theory),.