PowerPoint Presentation
Scene 1 (0s)
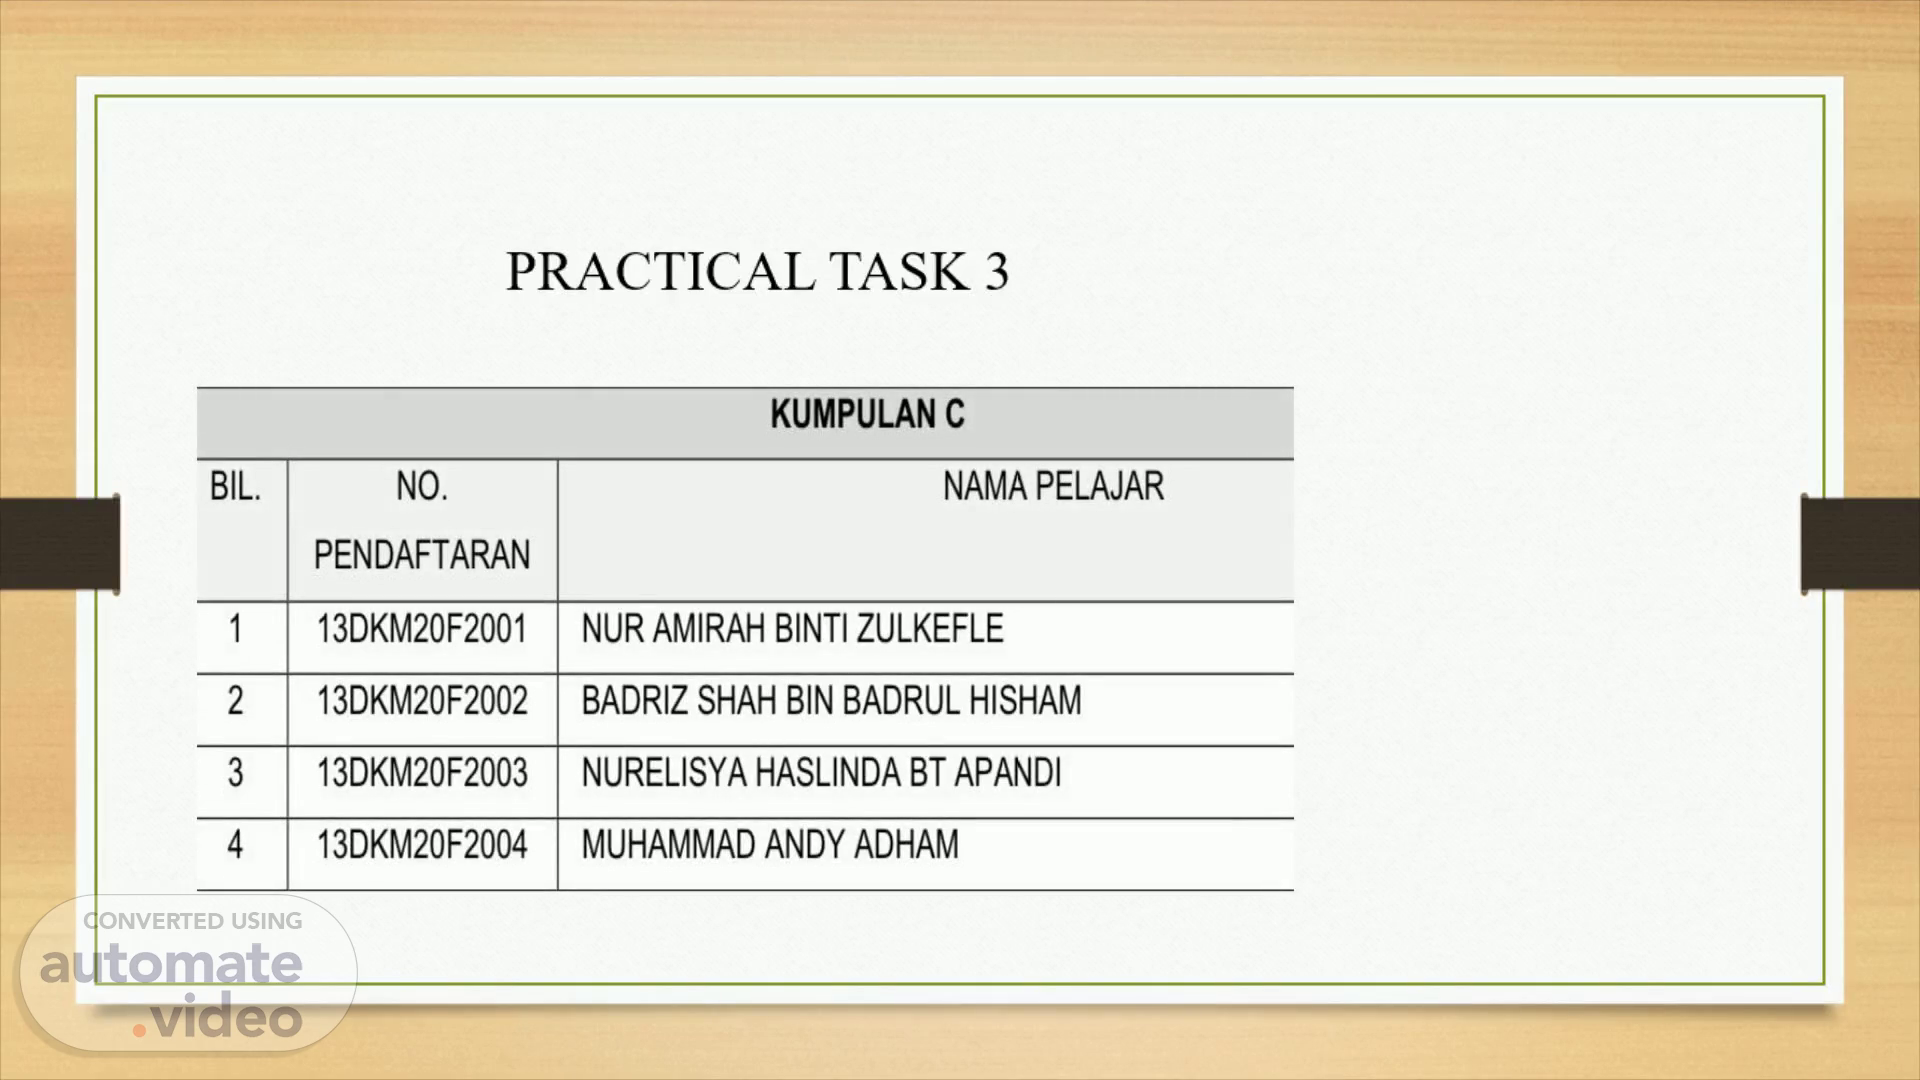
PRACTICAL TASK 3.
Scene 2 (6s)
OBJECTIVE. At the experiment,we should be able to explain the flow of fluid in venturi meter.This experiment tends to obtain both compressible and incompressible fluid in pipe line and graph between flow rate and pressue loss.
Scene 3 (19s)
I. Enter the link above into the address bar. 2. 3. 4. 5. 6. 7. 8. 9. 10. 11. 12. o Click on the drop-down list of water flow to select the water flow. Click on 'Start' button to start the experiment. Observe the flow of water through the exgmment and wait for the fluid to reach tank. When fluid reach to the tank, click on 'Close Valve' button to close the valve below the measuring tank. After clicking 'Close valve' button, wait for the fluid to come up to the '10 cm' mark. Click on 'Stop Timer' button when fluid reaches around '10 cm' mark. Click on 'Generate Table' button to reset the setup. Click on 'Reset' button to reset the setup. Again select the next water flow from drop-down list. After performing the experiment, calculate area, velocity, velæity head and pressure head for both the flow rates. Click Plot Graph button to plot the graph..
Scene 4 (1m 2s)
00 Ht -.04 t (3 s. to tQo t to 20 cef r 61 e tow recti... rec+:.
Scene 5 (1m 10s)
00 too.
Scene 6 (1m 15s)
DISCUSSION. FOR PRESSURE HEAD VS DISTANCE GRAPH THE TURNING POINT IS AT COORDINATE (250,177). THE GRAPH STARTED AT POINT (50,194) THEN DECREASED TO TURNING POINT AND INCREASED TO THE LAST POINT AT COODINATE (100,192)..
Scene 7 (1m 29s)
CONCLUSION. THE EXPERIMENT CAN CONCLUDE THAT, VENTURI METER CAN BE USED TO DETERMINE THE FLOW RATE IN THE PIPELINE AND THE PRESSURE LOST THAT OCCURING IN ORDER TO CONTROL THE DISCHARGE FLUID ADDITION TO THE DISCHARGE COEFFICIENT OF VENTURI METER.