Scene 1 (0s)
[image] ' SINAI UNIVERSITY c Ci-Lu_J L?. [image] OCULTY.
Scene 2 (12s)
Assessment Weight, Schedule and Grades Distribution:.
Scene 3 (25s)
Reference: Leonard L. Grigsby, ”Electric Power Engineering Handbook “, Third Edition - CRC Press, May , 2012..
Scene 4 (35s)
Contents Performance of Long Transmission Lines. Power Circle Diagram. Corona. Overhead Transmission Line Insulators. Transients in Power Systems , (Travelling waves, capacitive and inductive current switching, and lightning phenomena). DC Power Transmission. Per-unit Systems. Symmetrical Components and Sequence Networks..
Scene 5 (52s)
CHAPTER 1 Per Unit Calculations. 1. Power System Representation.
Scene 6 (1m 7s)
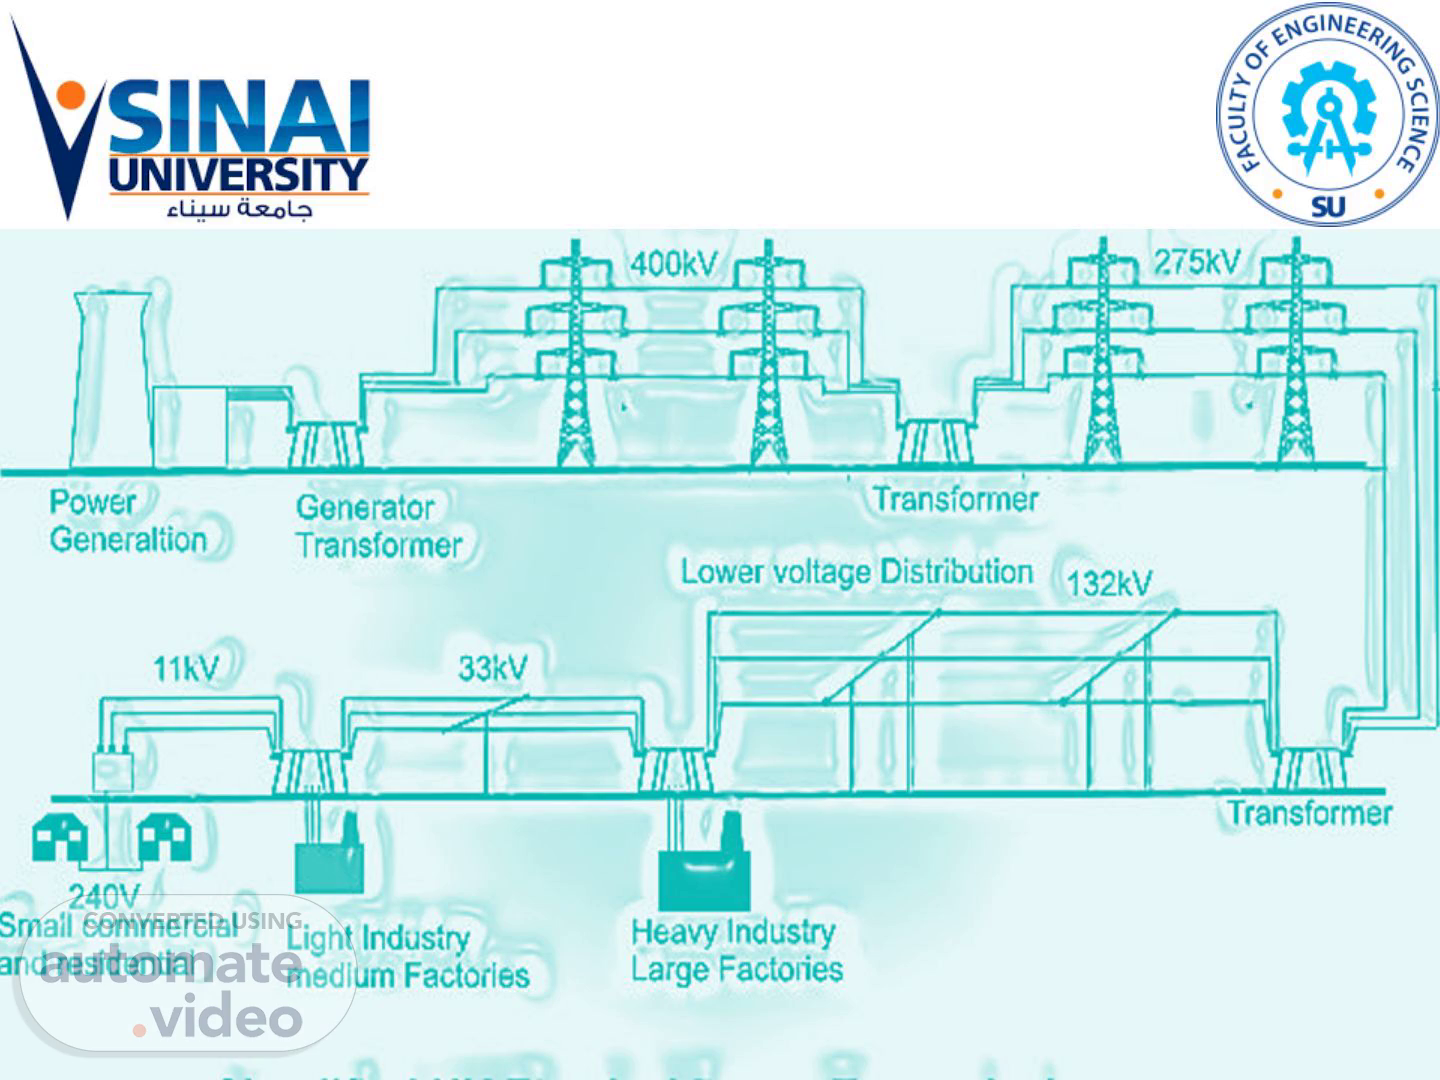
Interconnections among these components in the power system may be shown is a so-called one-line diagram or single-line diagram. Single-line diagram represents all 3- of balanced system. For the purpose of analysis, the single-line diagram of a particular power system network is represented to its equivalent reactance or impedance diagram. A sample of a interconnected of individual power component is shown in Figure 1.1. This represent a circuit diagram of a power network which is referred to as a single-line diagram..
Scene 7 (1m 34s)
Impedance diagram In power system fault calculations it is often that a single-line diagram representing a typical power network in 3- be converted into its per phase impedance diagram. Some assumptions for converting from single-line diagram into its equivalent impedance diagram needed to be considered. A generator can be represented by a voltage source in series with an inductive reactance. The internal resistance of the generator is assumed to be negligible compared to the reactance. (ii) The loads are usually inductive represented by resistance and inductance. (iii) The transformer core is assumed to be ideal, and the transformer may be represented by a reactance only. (iv) The transmission line is represented by its resistance and inductance, the line-to-ground capacitance is assumed to be negligible..
Scene 8 (2m 11s)
Generator G1 G2 Station A Station B G3 G4 Load L1 Load L2 Transformer T1 Transmission Line TL Transformer T2.
Scene 9 (2m 24s)
9. G2 G1 G3 G4 j X1 j X2 j X3 j X4 j XT1 j XT2 RL1 j XL1 RL2 j XL2 RTL j XTL Transformer T1 Transformer T2 Transmission Line TL Station A Station B.
Scene 10 (2m 38s)
10. Per-Unit Quantities Per unit quantities are quantities that have been normalized to a base quantity. In general,.
Scene 11 (3m 14s)
11. Combining (i) and (ii) yields,. where kVbase and MVAbase are 3- qualtities.
Scene 12 (3m 30s)
12. Determine the per-unit values of the following single-line diagram and draw the impedance diagram..
Scene 13 (3m 59s)
13. Transmission line TL:. p.u.. Transformer T2:.
Scene 14 (4m 12s)
14. Now, we have all the impedance values in per-unit with a common base and we can now combine all the impedances and determine the overall impedance..
