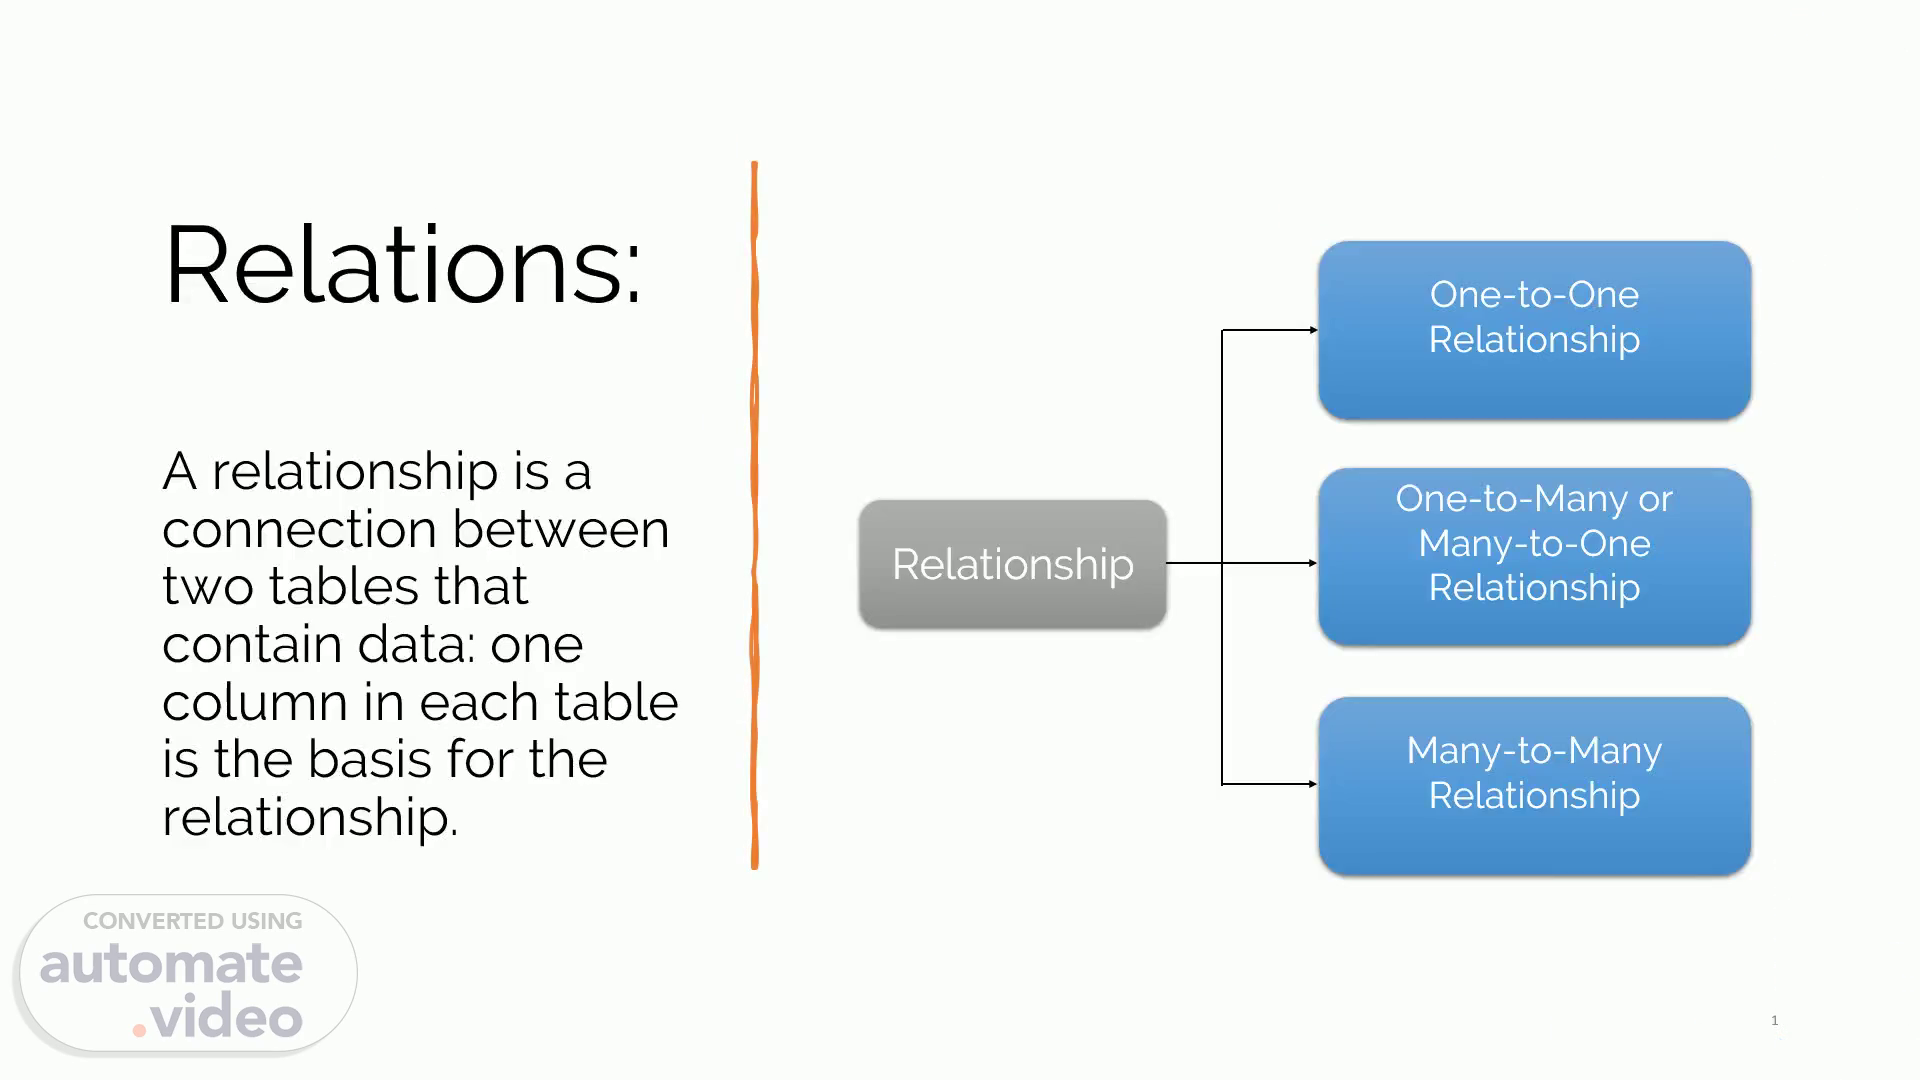
Relations: A relationship is a connection between two tables that contain data: one column in each table is the basis for the relationship.
Scene 1 (0s)
[Audio] A relationship is showcased by the diamond shape in the ER diagram. It depicts the relationship between two entities. Now let's go through the type of relationship..
Scene 2 (15s)
[Audio] First is one-to-one relationship. When a single element of an entity is associated with a single element of another entity, this is called one-to-one relationship. In the example below we have student and identification card as entities. We can see a student has only one identification card and an identification card is given to one student. It represents a one-to-one relationship. Now move on to one to many or many to one relationship..
Scene 3 (48s)
[Audio] Such a relationship exists when each record of one table can be related to one or more than one record of the other table. This relationship is the most common relationship found. A one-to-many relationship can also be said as a many-to-one relationship depending upon the way we view it. For example, If there are two entity type 'Customer' and 'Account' then each 'Customer' can have more than one 'Account' but each 'Account' is held by only one ' Customer'. In this example, we can say that each Customer is associated with many Account. So, it is a one-to-many relationship. But, if we see it the other way i.e., many Account is associated with one Customer then we can say that it is a many-to-one relationship. Next is Many to many relationship..
Scene 4 (1m 41s)
[Audio] Such a relationship exists, when each record of the first table can be related to one or more than one record of the second table and a single record of the second table can be related to one or more than one record of the first table. It is also represented as an N:N relationship. For example, If there are two entity type ' Customer' and ' Product' then each customer can buy more than one product and a product can be bought by many different customers..
Scene 5 (2m 10s)
[Audio] Now after having an understanding of E R diagram let us know the points to keep in mind while creating the entity relationship diagram. First identify all the entities in the system and embed all the entities in a rectangular shape and label them appropriately. This could be a customer, a manager, an order, an invoice, a schedule etc. Then identify relationships between entities and connect them using a diamond in the middle illustrating the relationship. Do not connect relationships, connect attributes with entities and label them appropriately and the attributes should assure that each entity only appears a single time and eradicate any redundant Entities or relationships in the E R diagram. Make sure your E R diagram supports all the data provided to design the database. Make effective use of colors to highlight key areas in your diagrams..
Scene 6 (3m 8s)
[Audio] As we have understood Entity relationship diagram, let's move to Data Warehouse. Here we will get familiar with data warehouse and its concepts covering OLAP, Dimensions, Facts and measures along with schema. At the end we will also go through data integration and have a look into ETL and ELT. Lets, start with Data Warehouse..
Scene 7 (3m 34s)
[Audio] Data warehouse Data warehouse is like a relational database designed for analytical needs. You have your database where your large amounts of data you'd be storing either in your database or even in form of flat files. But flat files like Excel or something cannot be used for storing large amounts of data. There is a limit on how much you can store in an Excel. So that is the case why you stored data in some kind of database. Example of databases are those of Oracle,my sequel, Microsoft sequel server. So you have all these databases you will store large amounts of data but the problem is they cannot be used for analytical purposes, so that is why we have to convert data from a database inside a data warehouse and when it is inside the data warehouse then we can perform analysis. So that's the advantage. Now the data that once has come into the data warehouse can be used for analysis, for visualization. All these things because you can look at the data from different angles because the data that comes into the data warehouse has more information rather than just data. It functions on the basis of OLAP. Online analytical processing is the whole process of running queries on data. Any kind of activity or querying on all these things, when it happens on data it's called OLAP. Data warehouse is basically the central location where a consolidated data from multiple locations are stored, so you get data in here from multiple locations, from multiple sources. You can get it from one or two databases or you can get from one or two flat files. You can get all this data as long as you are putting it inside the same table or inside the same columns and dimensions. You can get any amount of data from any source and you can get them all and store them all inside your data warehouse so is that all about data warehouse..
Scene 8 (5m 37s)
[Audio] Moving on the data warehousing concepts. Now let us understand the various concepts revolving around data warehousing like OLAP, dimensions, facts and schemas. So first of all let me give you a brief again. Let's go.
Scene 9 (5m 55s)
[Audio] OLAP is a flexible way for you to make complicated analysis of multi-dimensional data. So when we say multi-dimensional data then whatever data is stored in a database it has multiple views. You can perform analysis, then all the different tables will be linked with each other. So, there'll be different views, every different categories of data and all these things you know to perform analysis. Then you use the OLAP, run on that data and whatever data stored in a data warehouse that's called multi-dimensional data. You storing it is in the form of OLAP cubes. So you have O L T P on one side and OLAP on the other side. As you can see last line, it says OLTP systems use data stored in form of two-dimensional tables. An example of this would be any excel. So you will have your rows and you'll have your columns, you'll have your data stored over here. So this is your OLTP system. But reference with the OLAP is they'll be stored in form of OLAP cubes. So they'll be multiple dimensions there will be multiple views that you can get of the same data with respect to the year, with respect to the number of sales, with respect to the different products. You can get a single view of all these things so as you can see this diagram is more for 3d view so that's what will pure stands for, so we call it OLAP cubes..
Scene 10 (7m 28s)
[Audio] So the next topic that I am going to talk about is that of dimensions. The tables that describe the dimensions involved are called dimension tables. So, first of all to give you an example of what a dimension is in data base. You have different tables which will be a part of your database. Now similar to tables we have something called as dimensions in data warehouse. We have dimension tables which will have a set of attributes, so our customer dimension will have the customer details like the customers I D, customer name and the customer address and product dimension will have other set of attributes like product I D, product name and product type. Similarly, you will have a date dimension, which have order date, the shipment date and delivery date. So, each of these dimensions they talk about a different aspect of your entire data warehouse. This example is of e-commerce company and as you can see here it says the e-commerce company is the subject..
Scene 11 (8m 31s)
[Audio] The next topic that we have here is facts and measures. A fact is a measure that can be summed, averaged or manipulated. Every fact table contains two kinds of data a dimension key and a measure. Now what this means is you will have all your dimensions in your data warehouse but if you want to perform any kind of query like sorting or analysis or some kind of drill down. You can only do it if you have a fact. So, for every dimension you will have an associated fact and using the fact you can measure your dimensions. So that's what it says here if you want to measure the data that you have in your data warehouse, then you use the fact to measure your dimensions and that is the reason why your fact table will have two kinds of data. It will have a dimension key which will basically be the link to your dimension table and then it will have a measure, so your measure is something that's going to calculate the data that is there in your dimension, so that is the relation. In the final line it also ruled that for every dimension table is linked to a fact table. So, you cannot have any dimension table in your data warehouse without a fact table and that is what is the whole process that leads us to having lot of flexibility with respect to querying and analysis. So, take this example in your fact table. You will have one product dimension and then that will have a dimension key and a measure. So, your dimension key would be Product I D and your measure would be the number of units sold. So, your product can be your fact table and your dimension key might be Product I D. So, you'll have all the different products that you have in your repository and if you want to find number of units sold, then you can perform any kind of arithmetic operation there and measure of that will be stored over here as the number of units sold. That's the whole concept of facts and measures..
Scene 12 (10m 27s)
[Audio] Moving next, we have schemas. A schema is basically which gives the logical description of your entire database. It gives details about the constraints placed on the tables, key values present and how the key values are linked between the different tables. Now what this means is you have different dimensions or if you take the example of a database, you have different tables. So, you have multiple tables you will have an employee table, you will have a department table and how do you link them. By using the whole primary key, foreign key relationship right. So that's the example that's showed over here. In your employee table you have a department I D which acts as the foreign key and then you have your department table, where Department I D is the primary key and you use the department I D to do any lookups. So that's the whole concept. Now we will move on to data integration..
Scene 13 (11m 27s)
[Audio] When we talk about data flows, there are two sides of equation. On one side, there are data producers and on the other side, there are data consumers. In the middle there is a process which moves and transforms data from its original format in source systems into target systems and format that fits data consumers business needs, that process is called data integration. Data integration refers to the process and technologies for data movement from source data systems to target data systems. On its way data are transformed in order to fit business requirements. On its way from data producers to data consumers data can go through multiple source to target layers. For example, from operational sources to staging area or from staging area to data warehouse etc. Now let's discuss data integration scenarios..
Scene 14 (12m 26s)
[Audio] First scenario is ETL, which is an acronym of extract transform and load. ETL refers to the data integration approach, where data is extracted from source systems then going through transformation process and ends up by loading in target system. ETL scenario is typical for data warehouse systems. Let's see how ETL scenario is actually works. As a first step we extract data from operational sources and that refers to the letter E from ETL abbreviation. As a next step data is transformed into required format that refers to the letter T in ETL abbreviation. Typical transformations are different kind of calculations or aggregations. For example, total revenue per quarter for each regional office. Finally transformed data is loaded into target system and available for use by data consumer that refers to the letter L..
Scene 15 (13m 27s)
[Audio] Another slightly different scenario is ELT, which is abbreviation of extract Load and transform. ELT refers to the data integration approach, where data extracted from source systems and then loaded into target system without any transformation. Transformation of data is performed later in the target system. ELT scenario is typical for Big Data and Hadoop systems. Let's see how ELT scenario is actually works. Same was in previous scenario the process starts with data extraction from operational sources which refers to letter E from ELT abbreviation. As a next step data is loaded into the target system in its native format without any transformation that refers to letter L and ELT abbreviation. Finally, data is transformed in the target system in order to fit consumer requirements, that refers to letter T and ELT abbreviation..