PowerPoint Presentation
Scene 1 (0s)
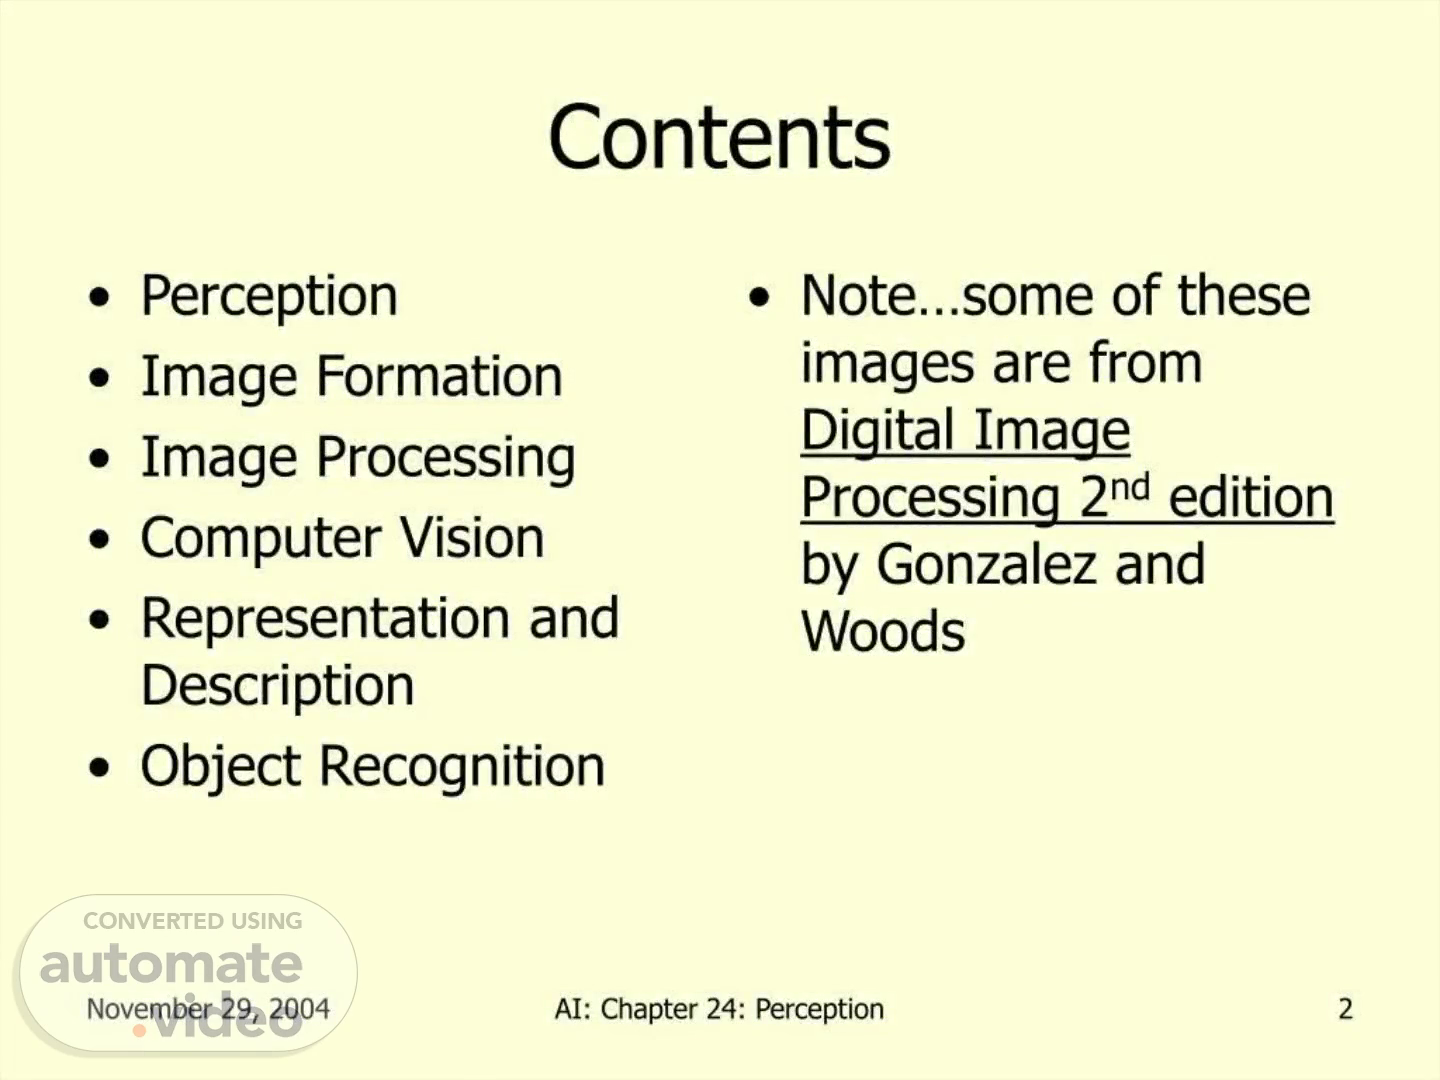
Contents Perception • Image Formation • Image Processing • Computer Vision • Representation and Description • Object Recognition November 29, 2004 A1: Chapter 24: • Note...some of these images are from Digital Image Processing 2nd edition by Gonzalez and Woods Perception 2.
Scene 2 (11s)
Perception • Perception provides an agent with information about the world they inhabit — Provided by sensors • Anything that can record some aspect of the environment and pass it as input to a program — Simple 1 bit sensors...Complex human retina November 29, 2004 A1: Chapter 24: Perception 3.
Scene 3 (26s)
Perception • There are basically two approaches for perception — Feature Extraction • Detect some small number of features in sensory input and pass them to their agent program • Agent program will combine features with other information • "bottom up" — Model Based • Sensory stimulus is used to reconstruct a model of the world • Start with a function that maps from a state of the world to a stimulus • "top down" November 29, 2004 A1: Chapter 24: Perception 4.
Scene 5 (50s)
Computer Vision Systems FIGURE 1.23 Fundamental steps in digital image processing. Problem domain November 29, 2004 Outputs of these processes generally are images Image restoration (IIAVITRS Image enhancement CllAVIYR2 Image acquisition Knowledge base 10 Segmentation Representation & description 12 Obj ect recognition A1: Chapter 24: Perception 8.
Scene 6 (1m 1s)
Image Formation • An image is a rectangular grid of data of light values — Commonly known as pixels • Pixel values can be... — Binary — Gray scale — Color — Multimodal • Many different wavelengths (IR, UV, SAR, etc) November 29, 2004 A1: Chapter 24: Perception 9.
Scene 7 (1m 16s)
image Plane November 29, 2004 Image Formation x z pinhole A1: Chapter 24: Perception 10.
Scene 8 (1m 23s)
Image Formation Illumination (energy) source Output (digitized) image Imaging system (Internal) image plane Scene element FIGURE 2.15 An example of the digital image acquisition process (a) Energy ("illumination") source. (b) An el- ement of a scene. (c) Imaging system. (d) Projection of the scene onto the image plane. (e) Digitized image. November 29, 2004 A1: Chapter 24: Perception.
Scene 9 (1m 39s)
Image Processing • Image processing operations often apply a function to an image and the result is another image — "Enhance the image" in some fashion — Smoothing — Histogram equalization — Edge detection • Image processing operations can be done in either the spatial domain or the frequency domain November 29, 2004 A1: Chapter 24: Perception 15.
Scene 11 (2m 0s)
Image Processing FIGURE 3.9 (a) Aerial image. Results of applying the transformation in Eq. (3.2-3) with c — I and Y = 3.0.4.0. and 5.0, respectively. (Original image for this example courtesy of NASA.) November 29, 2004 A1: Chapter 24: Perception 17.
Scene 12 (2m 15s)
Image Processing • Image data can be represented in a spatial domain or a frequency domain • The transformation from the spatial domain to the frequency domain is accomplished by the Fourier Transform • By transforming image data to the frequency domain, it is often less computationally demanding to perform image processing operations November 29, 2004 A1: Chapter 24: Perception 18.
Scene 13 (2m 31s)
Computer Vision • Contour Tracing • Connected Component Analysis — When can we say that 2 pixels are neighbors? — In general, a connected componentis a set of black pixels, P, such that for every pair of pixels and pj in P, there exists a sequence of pixels p, p; such that: • all pixels in the sequence are in the set P i.e. are black, and • every 2 pixels that are adjacent in the sequence are "neighbors" November 29, 2004 A1: Chapter 24: Perception 46.
Scene 15 (2m 58s)
Representation and Description • Topological descriptors — "Rubber sheet distortion" • Donut and coffee cup — Number of holes — Number of connected components — Euler Number .E=C-H November 29, 2004 A1: Chapter 24: Perception 48.
Scene 16 (3m 10s)
Representation and Description FIGURE 11.17 A region with twoholes FIGtJRE 11.19 Regions with Euler number equal too and —1. respectively. FIGURE 11.18 A region with three connected components November 29, 2004 A1: Chapter 24: Perception 49.
Scene 18 (3m 28s)
Object Recognition Image Buildings Downtown Highways Housing Small structures Residential Shopping malls wooded areas Hig ways High densitity Large Multiple Numerous Loops Low intersections structures density Single FIGURE 12.5 A tree description of the image in Fig. 12.4. November 29, 2004 A1: Chapter 24: Perception Few intersections 55.
Scene 20 (3m 45s)
Object Recognition • Each point is described by its local context histogram — (number of points falling into each log-polar grid bin) November 29, 2004 n A1: Chapter 24: Perception 11 9 60.
Scene 21 (3m 57s)
Object Recognition • Determine total distance between shapes by sum of distances for corresponding points under best matching November 29, 2004 A1: Chapter 24: Perception i IttJt4t 61.
Scene 22 (4m 6s)
Object Recognition FIGURE 12.18 (a) Reference shapes and (b) typical noisy shapes used in training the neural network of fig. 12.19. (Courtesy of Dr. Gupta. ECT I)epartment. Southern Illinois U niversity.) November 29, 2004 1 2 4 Shape 2 A1: Chapter 24: Perception Shavx 3 Sha'N 3 4 4 62.
Scene 23 (4m 20s)
Summary • Computer vision is hard!!! — noise, ambiguity, complexity • Prior knowledge is essential to constrain the problem • Need to combine multiple cues: motion, contour, shading, texture, stereo • "Library" object representation: shape vs. aspects • Image/object matching: features, lines, regions, etc. November 29, 2004 A1: Chapter 24: Perception 63.